
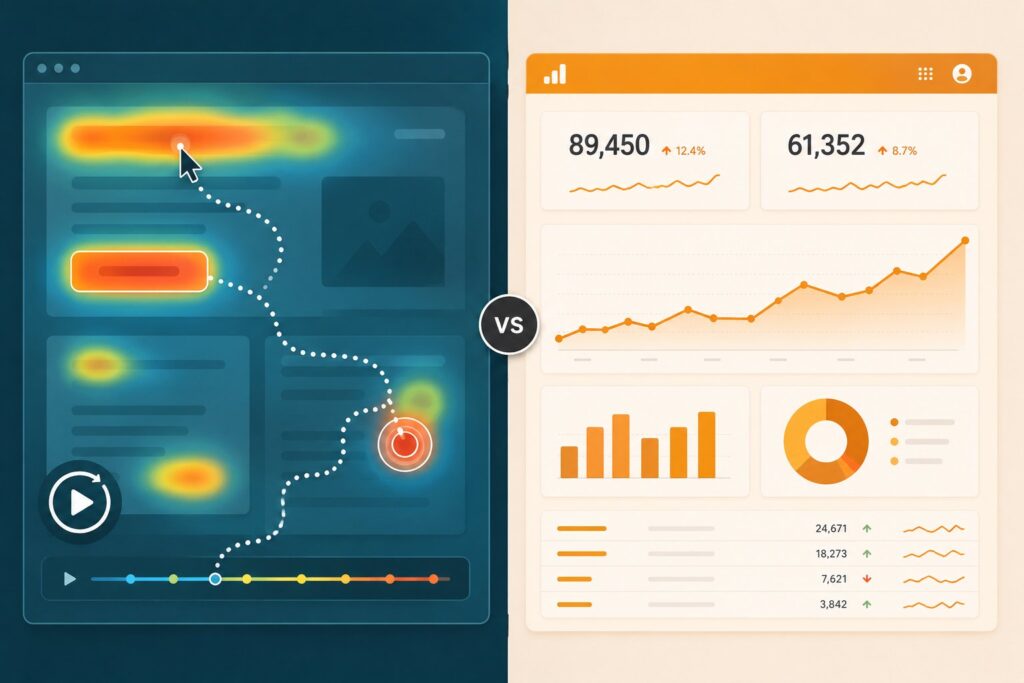
Comparing Microsoft Clarity vs Google Analytics 4 is not a fight to pick a winner. They answer different questions, and most teams that use analytics well run both. Google Analytics 4 (GA4) is a quantitative tool: it counts what happened on your site, how many sessions, which pages, which events, which conversions, and where the traffic came from. Microsoft Clarity is a qualitative tool: it shows you how individual people actually behaved, through heatmaps and recordings of real sessions. GA4 tells you your checkout page has a 60% drop-off. Clarity shows you the recording of someone rage-clicking a button that does nothing. You need both the numbers to know something is wrong and the pictures to know why.
This guide covers what each tool is built for, where each one wins, the tradeoffs neither vendor puts on the marketing page, and how teams wire them together so a spike in one becomes a session replay in the other.
Two different tool types, not two versions of the same thing
The most common mistake is treating these as competitors on the same axis. They are not.
Quantitative analytics answers what and how many. It aggregates behavior into counts, rates, and trends: 12,000 sessions, a 3.2% conversion rate, 40% of traffic from organic search. That is what GA4 does. It is the system of record for whether a change moved the numbers.
Qualitative analytics answers how and why. Instead of aggregating people into a number, it preserves the individual experience: the path a cursor took, where a visitor stalled, the element they clicked five times in frustration. That is Clarity’s job. It does not tell you your conversion rate; it tells you what the 97% who did not convert were doing instead.
If you have read our Microsoft Clarity 101 walkthrough and our breakdown of what’s new in Google Analytics 4, you already have the individual mechanics. This post is about the decision layer on top: which one to reach for, and when.
What Google Analytics 4 is for
GA4 is Google’s quantitative analytics platform, and it replaced Universal Analytics when that product was sunset in July 2023. Its whole model is event-based: every interaction, a page view, a scroll, a click, a purchase, is an event with parameters, rather than the old session-and-pageview model.
GA4 earns its place when you need to:
- Measure conversions and events: track sign-ups, purchases, form submissions, and any custom event you define, then see conversion rates over time.
- Understand acquisition: see which channels (organic, paid, social, referral, direct) and campaigns bring traffic, and how each performs.
- Attribute credit across a journey: GA4’s data-driven attribution spreads conversion credit across the touchpoints in a path rather than handing it all to the last click, and it is now GA4’s default model.
- Segment and compare: build audiences, compare cohorts, and slice behavior by device, geography, or any dimension you collect.
- Feed the ad stack: GA4 links to Google Ads and the wider Google Marketing Platform, so conversions can inform bidding.
The through-line: GA4 is the tool you use to answer did this work, and where should the budget go. When a client asks whether last month’s campaign paid off, the answer lives in GA4.
Where GA4 has sharp edges
GA4 is powerful and genuinely free at the standard tier, but it hides a few realities worth knowing before you lean on it.
Data retention is capped. In the standard (free) property, user-level and event-level data in the reporting interface defaults to two months and can be raised to a maximum of 14 months, a setting you change manually in Data Settings (Google Analytics Help). Aggregated standard reports are not affected, but the Explorations you build on raw event data are. If you need history beyond that window, the standard escape hatch is exporting to BigQuery, where raw events persist for as long as the table exists with no retention cap.
Sampling kicks in on large datasets. GA4 Explorations start applying data sampling once a query crosses roughly ten million events, which means the numbers become estimates rather than exact counts. High cardinality is a separate failure and behaves differently: dimensions with more than 500 distinct daily values push rows past the report limit into an aggregated (other) row, which is truncation rather than estimation. The BigQuery export helps with both, but it is not unlimited on the free tier: standard properties are capped at one million exported events a day, and exceeding it stops that day’s export. If those limits are a real constraint, the paid enterprise tier raises them substantially, which we unpack in what Google Analytics 360 is.
And GA4 is a learning curve. The event-based model, the Explorations builder, and the reporting interface are noticeably less intuitive than the old Universal Analytics, which is a real cost for small teams.
What Microsoft Clarity is for
Microsoft Clarity is Microsoft’s free behavioral analytics tool, and its pitch is refreshingly narrow: understand how real people use your pages. It does four core things, the last of which is a growing layer of AI on top.
- Heatmaps: click, scroll, and area maps that show, in aggregate, where attention concentrates and how far down the page people actually get.
- Session recordings: replays of individual visits so you can watch the real path a person took, cursor movement and all.
- Frustration signals: automatic detection of rage clicks (rapid repeated clicks on the same spot) and dead clicks (clicks on things that do not respond), which are some of the fastest ways to find broken or confusing UI.
- Insights dashboard: automatic summaries that surface what is working and what is not without you scrubbing through hours of footage.
Clarity earns its place when a number in GA4 raises a question that a number cannot answer. Your product page converts poorly: why? Clarity’s heatmap shows nobody scrolls to the add-to-cart button because a fake "hero" image looks like the end of the page. Your form has a high abandonment rate: which field? A recording shows people bailing at a phone-number input that rejects valid formats.
Two Clarity facts change the calculus for smaller sites. First, it is genuinely free with a single tier, with unlimited traffic and unlimited sites. There is a ceiling, though, and it is not advertised: Clarity records up to 100,000 sessions per project per day, and heatmaps cap at 100,000 page views each. Below that you capture every visit at volumes where GA4 would start estimating. Second, that scope makes it a natural companion to, not a replacement for, a metrics tool. If you are weighing heatmap options specifically, we cover a paid alternative in what Crazy Egg is.
Where Clarity has sharp edges
Clarity is not a reporting tool, and trying to use it as one is the mistake. It will not give you clean conversion rates, channel attribution, or revenue reporting; that is not what it is for. Watching recordings is qualitative and time-consuming, and it is easy to over-index on a handful of vivid sessions that are not representative. Clarity’s AI layer, Copilot in Microsoft Clarity, helps by summarizing recordings and answering plain-language questions about your data, but a summary is still a starting point, not a statistic. And because it is a Microsoft product, it sits outside the Google Marketing Platform, so it does not feed Google Ads or GA4 audiences on its own.
Microsoft Clarity vs Google Analytics 4: side by side
| Dimension | Microsoft Clarity | Google Analytics 4 |
|---|---|---|
| Tool type | Qualitative (behavior) | Quantitative (metrics) |
| Core question | How and why did people behave this way? | What happened, and how much? |
| Headline features | Heatmaps, session recordings, rage/dead clicks | Events, conversions, acquisition, attribution |
| Cost | Free, single tier | Free standard tier; GA360 is paid |
| Sampling | None | Applies in Explorations on large datasets |
| Data retention | Recordings 30 days, heatmaps 9 months | 2 to 14 months in-UI (standard), longer via BigQuery |
| Best for | Diagnosing UX problems | Measuring performance and ROI |
How teams use them together
The real answer to "Microsoft Clarity vs Google Analytics 4" is both, in sequence. GA4 finds the problem; Clarity explains it. The workflow that gets the most out of the pair looks like this:
- Spot the anomaly in GA4. A conversion rate drops, a page’s engagement falls, a funnel step leaks. GA4’s quantitative view is what surfaces the where.
- Jump to the recordings in Clarity. Clarity’s GA4 integration connects the two, so the segment that dropped can become footage of the exact people who dropped.
- Diagnose the cause qualitatively. Watch a handful of those recordings, or read Clarity’s summary of them, and look for the rage clicks, dead clicks, and stalls that explain the number.
- Verify the fix quantitatively. Ship the change, then go back to GA4 to confirm the conversion rate actually recovered. A fix that feels right in a recording still has to move the aggregate number to count.
The integration runs one way, and it is worth being precise because most write-ups get this backwards. GA4 traffic sources and event data surface inside Clarity, where you can then filter to recordings of people who arrived from paid search or who triggered a particular event. Clarity does not push a playback URL back into GA4. Microsoft says so directly, explaining that Clarity cannot send playback URLs to GA4 because GA4 will not accept high-cardinality rows, and that Clarity segments are not supported in GA4 either.
So which one should you set up first?
If you are starting from zero, install both; they are both free at the tier most small and mid-sized sites need, and each takes a snippet of JavaScript. If you can only stand up one this week, choose by the job in front of you. Need to prove marketing ROI, report to a client, or feed Google Ads? Start with GA4. Trying to fix a page that is quietly failing and you do not know why? Start with Clarity, because it will hand you an answer in an afternoon of watching recordings that GA4 could only hint at.
The teams that get stuck are the ones that pick one and treat it as complete. GA4 alone leaves you knowing exactly how badly a page performs and having no idea why. Clarity alone leaves you with vivid stories and no way to know whether they represent 3% or 30% of your visitors. Run together, the numbers tell you where to look and the recordings tell you what to change.
Frequently Asked Questions
Is Microsoft Clarity really free, with no catch?
Yes, with one caveat worth knowing. Clarity is free with a single tier and no limit on traffic or the number of sites, but it records up to 100,000 sessions per project per day, and each heatmap caps at 100,000 page views. The tradeoff is scope, not price: it is a behavioral tool, not a full reporting or attribution platform, so it complements a quantitative tool rather than replacing one. Our Microsoft Clarity 101 guide covers setup end to end.
Can Microsoft Clarity replace Google Analytics 4?
No, and it is not designed to. Clarity does not produce channel attribution, conversion reporting, or the audience and campaign data that GA4 exists to provide. If you need to answer “did this campaign pay off” or “where is my traffic coming from,” that lives in GA4. Clarity answers the different question of how individual visitors behaved on the page.
Do Clarity and GA4 conflict if I run both?
No. They are independent tags that collect independently, and Microsoft actively supports running them together through a GA4 integration. Connecting them surfaces GA4 traffic and event data inside Clarity, so you can filter recordings by acquisition channel or event. The link does not run the other way: Microsoft states that Clarity does not send playback URLs into GA4, because GA4 will not accept high-cardinality rows.
Why does GA4 only show me a couple of months of data?
GA4’s standard property defaults user- and event-level retention in the reporting interface to two months, with a maximum of 14 months that you set manually in Data Settings. Standard aggregated reports are not capped, but the Explorations you build on event data are. To keep raw history beyond that window, export to BigQuery, where events persist with no retention limit. Retention options change periodically, so confirm the current settings in your own property.
Which should I set up first, Clarity or GA4?
Install both if you can; each is free at the tier most sites need, and each is a single JavaScript snippet. If you have to choose, let the immediate job decide. Reach for GA4 when you need to report performance, prove ROI, or feed Google Ads. Reach for Clarity when a specific page is underperforming and you need to see why before you can fix it.
How is Microsoft Clarity different from a tool like Crazy Egg?
Both produce heatmaps and session recordings, so they overlap on the qualitative side. The main differences are price and scope: Clarity is free with no traffic limits, while paid tools in the category often bundle A/B testing and other conversion-optimization features. We break down one such alternative in what Crazy Egg is. Neither replaces GA4’s quantitative reporting.
Is there a paid version of Google Analytics 4?
Yes. Google Analytics 360 is the enterprise tier of GA4, sold through the Google Marketing Platform. It raises the collection, sampling, and retention limits of the free tier for high-traffic organizations. We explain the differences in what Google Analytics 360 is.
Does either tool have limits I should know about before committing?
Both do, and neither advertises them. Clarity records up to 100,000 sessions per project per day, caps each heatmap at 100,000 page views, keeps recordings for 30 days and heatmaps for nine months. GA4 samples Explorations past roughly ten million events per query, condenses high-cardinality dimensions into an aggregated row, and caps free-tier BigQuery export at one million events a day. Check your traffic against those numbers before either becomes your system of record.